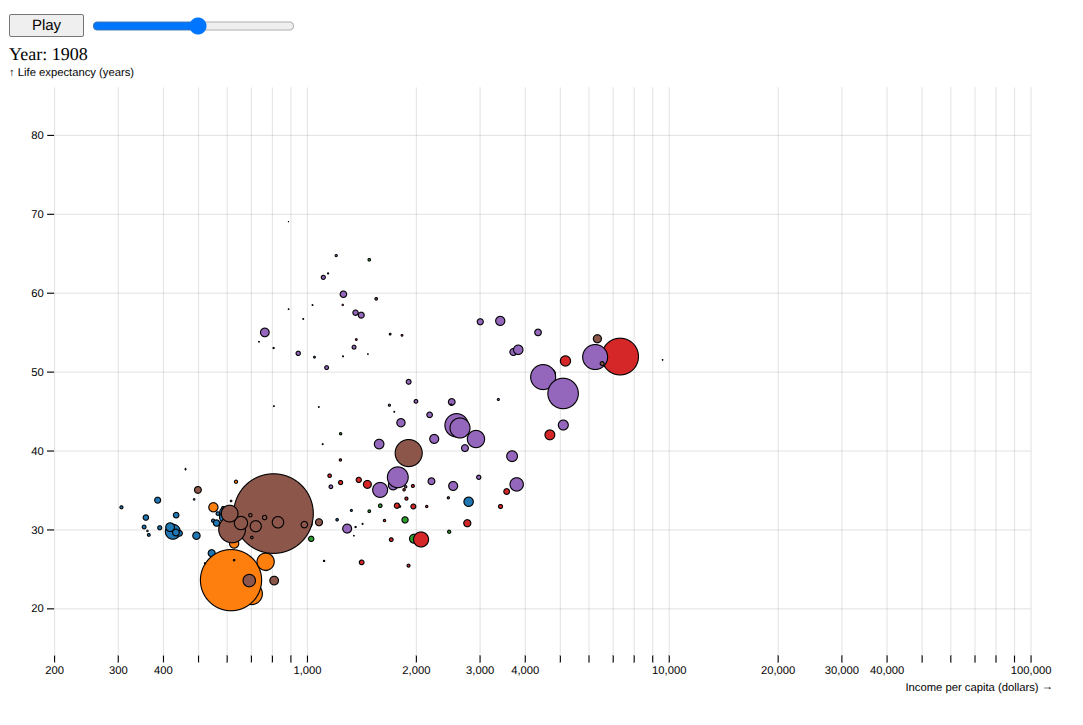
Wealth and Health of Nations
Load and prepare data
import json
from bisect import bisect_left
from collections import namedtuple
from dataclasses import dataclass
from datetime import datetime
from operator import itemgetter

import detroit_live as d3
import requests

Margin = namedtuple("Margin", ("top", "right", "bottom", "left"))

URL = "https://static.observableusercontent.com/files/2953b6cf84ed92fb8fa449c1d2e2491075f6ede3d87822224a3108f5e40cb2cd2bee040c4e078863efbe06a2c125c846bbd596604b0c75ac11138a3093ad1126?response-content-disposition=attachment%3Bfilename*%3DUTF-8%27%27nations.json"
nations = json.loads(requests.get(URL).content)


def parse_series(
    series: list[tuple[int, float]] | None,
) -> list[tuple[datetime, float]] | None:
    if series is None:
        return
    return [[datetime(year, 1, 1), value] for year, value in series]


@dataclass
class Data:
    name: str
    region: str
    income: list[tuple[datetime, float]] | float | None
    population: list[tuple[datetime, float]] | float | None
    life_expectancy: list[tuple[datetime, float]] | float | None


data = [
    Data(
        d.get("name"),
        d.get("region"),
        parse_series(d.get("income")),
        parse_series(d.get("population")),
        parse_series(d.get("lifeExpectancy")),
    )
    for d in nations
]
Prepare the scatter chart
# Declare the chart dimensions and margins
width = 928
height = 560
margin = Margin(20, 20, 35, 40)


def data_index(d, index):
    return [d.income[index], d.population[index], d.life_expectancy[index]]


interval = d3.time_month
dates = interval.range(
    min(map(lambda d: min(map(itemgetter(0), data_index(d, -1))), data)),
    min(map(lambda d: max(map(itemgetter(0), data_index(d, -1))), data)),
)

# Declare the x (horizontal position) scale.
x = d3.scale_log([200, 1e5], [margin.left, width - margin.right])
# Declare the y (vertical position) scale.
y = d3.scale_linear([14, 86], [height - margin.bottom, margin.top])
# Declare the radius scale.
radius = d3.scale_sqrt([0, 5e8], [0, width / 24])
# Declare the color scale.
color = d3.scale_ordinal([d.region for d in data], d3.SCHEME_CATEGORY_10).set_unknown(
    "black"
)


# Returns value on a specified date
def value_at(values: list[tuple[datetime, float]], date: datetime) -> float:
    i = bisect_left(list(map(itemgetter(0), values)), date, 0, len(values) - 1)
    a = values[i]
    if i > 0:
        b = values[i - 1]
        t = (date - a[0]) / (b[0] - a[0])
        return a[1] * (1 - t) + b[1] * t
    return a[1]


# Returns data on a specified date
def data_at(date):
    return [
        Data(
            d.name,
            d.region,
            value_at(d.income, date),
            value_at(d.population, date),
            value_at(d.life_expectancy, date),
        )
        for d in data
    ]

# Add grid
def grid(g):
    def horizontal_lines(g):
        (
            g.append("g")
            .select_all("line")
            .data(x.ticks())
            .join("line")
            .attr("x1", lambda d: 0.5 + x(d))
            .attr("x2", lambda d: 0.5 + x(d))
            .attr("y1", margin.top)
            .attr("y2", height - margin.bottom)
        )

    def vertical_lines(g):
        (
            g.append("g")
            .select_all("line")
            .data(y.ticks())
            .join("line")
            .attr("y1", lambda d: 0.5 + y(d))
            .attr("y2", lambda d: 0.5 + y(d))
            .attr("x1", margin.left)
            .attr("x2", width - margin.right)
        )

    (
        g.attr("stroke", "currentColor")
        .attr("stroke-opacity", 0.1)
        .call(horizontal_lines)
        .call(vertical_lines)
    )


# Add the x-axis and x label
def x_axis(g):
    (
        g.attr("transform", f"translate(0, {height - margin.bottom})")
        .call(d3.axis_bottom(x).set_ticks(width / 80, ","))
        .call(lambda g: g.select(".domain").remove())
        .call(
            lambda g: (
                g.append("text")
                .attr("x", width)
                .attr("y", margin.bottom - 4)
                .attr("fill", "currentColor")
                .attr("text-anchor", "end")
                .text("Income per capita (dollars) →")
            )
        )
    )


# Add the y-axis and y label
def y_axis(g):
    (
        g.attr("transform", f"translate({margin.left}, 0)")
        .call(d3.axis_left(y))
        .call(lambda g: g.select(".domain").remove())
        .call(
            lambda g: (
                g.append("text")
                .attr("x", -margin.left)
                .attr("y", 10)
                .attr("fill", "currentColor")
                .attr("text-anchor", "start")
                .text("↑ Life expectancy (years)")
            )
        )
    )


# Create containers
html = d3.create("html")
body = html.append("body")
svg = (
    body.append("div")
    .append("svg")
    .attr("width", width)
    .attr("height", height)
    .attr("viewBox", [0, 0, width, height])
)

svg.append("g").call(x_axis)
svg.append("g").call(y_axis)
svg.append("g").call(grid)

circle = (
    svg.append("g")
    .attr("stroke", "black")
    .select_all("circle")
    .data(data_at(datetime(1800, 1, 1)), lambda d: d.name)
    .join("circle")
    .attr("cx", lambda d: x(d.income))
    .attr("cy", lambda d: y(d.life_expectancy))
    .attr("r", lambda d: radius(d.population))
    .attr("fill", lambda d: color(d.region))
    .call(
        lambda circle: circle.append("title").text(
            lambda d: "\n".join((d.name, d.region))
        )
    )
)
Create event producers mixed with event listeners.
# Add play button and slider before SVG
buttons = (
    body.insert("div", "svg")
    .attr(
        "style",
        "font: 12px var(--sans-serif);"
        " font-variant-numeric: tabular-nums;"
        " display: flex; height: 33px; align-items: center;"
    )
)
play_button = (
    buttons.append("button")
    .attr("name", "play")
    .attr("style", "margin-right: 0.4em; width: 5em;")
    .text("Play")
)
slider = (
    buttons.append("input")
    .attr("name", "year")
    .attr("type", "range")
    .attr("min", "1800")
    .attr("max", "2006")
    .attr("value", "1800")
    .attr("step", "1")
    .attr("style", "width: 180px;")
)
span = body.insert("div", "svg").append("span").text("Year: 1800")

# Convenient class to keep play button and slider states
class ButtonState:
    def __init__(self):
        self.is_pause = False
        self.slider_value = 1800
        self.event_producers = d3.event_producers()
        self.timer_modifier = None

    # Play button: Listener callback
    def play_event(self, event, d, node):
        if self.is_pause:
            play_button.text("Play")
            if self.timer_modifier is not None:
                self.timer_modifier.stop()
            self.is_pause = False
        else:
            play_button.text("Pause")
            # Create a event producer (interval timer)
            self.timer_modifier = self.event_producers.add_interval(
                self.increase_slider,
                updated_nodes=circle.nodes() + span.nodes() + slider.nodes(),
                html_nodes=span.nodes(),
                delay=50,
            )
            self.is_pause = True

    def update(self):
        date = self.slider_value
        slider.attr("value", date)
        current_data = data_at(datetime(date, 1, 1))
        (
            circle.data(current_data, lambda d: d.name)
            .attr("cx", lambda d: x(d.income))
            .attr("cy", lambda d: y(d.life_expectancy))
            .attr("r", lambda d: radius(d.population))
        )
        span.text(f"Year: {date}")

    # Slider: Listener callback
    def slider_event(self, event, d, node):
        play_button.text("Play")
        if self.timer_modifier is not None:
            self.timer_modifier.stop()
        self.is_pause = False

        self.slider_value = int(event.value)
        self.update()

    # Producer callback
    def increase_slider(self, elapsed, timer_event):
        if self.slider_value > 2005:
            timer_event.set()
            return

        self.slider_value += 1
        self.update()

button_state = ButtonState()

# Add event listeners to play button and slider
play_button.on("click", button_state.play_event, html_nodes=play_button.nodes())
slider.on(
    "input",
    button_state.slider_event,
    extra_nodes=circle.nodes() + span.nodes() + slider.nodes(),
    html_nodes=span.nodes() + play_button.nodes(),
)
Create an application and run it locally
html.create_app().run()
Note
Since the transition are not implemented in the current version, the animation is not as smooth as the d3js example.