Disjoint Force Graph
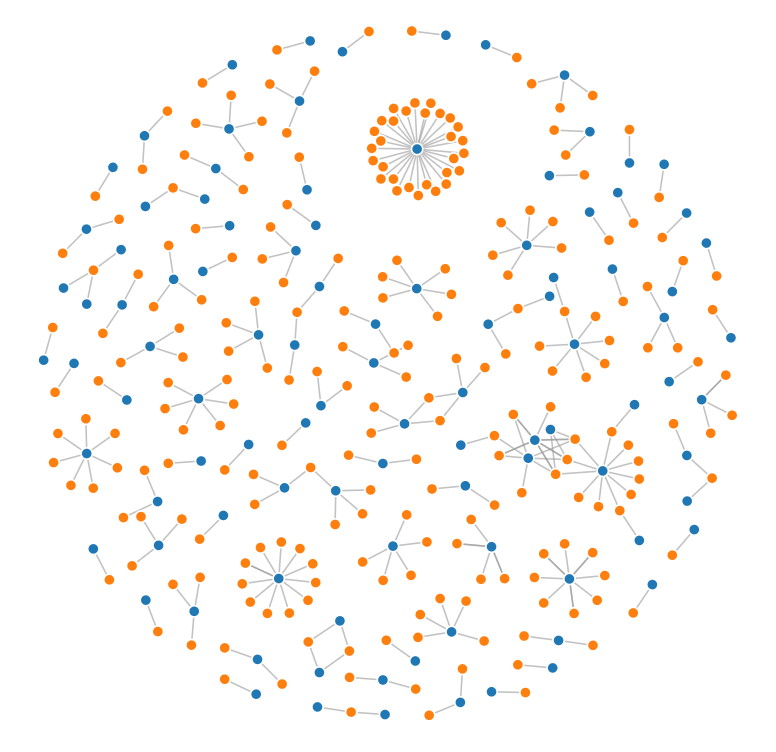
Load data
# https://observablehq.com/@d3/disjoint-force-directed-graph/2
import json
from math import sqrt
import requests
import detroit_live as d3

URL = "https://static.observableusercontent.com/files/e3680d5f766e85edde560c9c31a6dba2ddfcf2f66e1dced4afa18d8040f1f205e0bde1b8b234d866373f2bfc5806fafc47e244c5c9f48b60aaa1917c1b80fcb7?response-content-disposition=attachment%3Bfilename*%3DUTF-8%27%27graph.json"

data = json.loads(requests.get(URL).content)
Prepare the force graph
width = 928
height = 680

# Specify the color scale.
color = d3.scale_ordinal(d3.SCHEME_CATEGORY_10)

# The force simulation mutates links and nodes, so create a copy
# so that re-evaluating this cell produces the same result.
links = data["links"]
nodes = data["nodes"]

# Create a simulation with several forces.
simulation = (
    d3.force_simulation(nodes)
    .set_force("link", d3.force_link(links).set_id(lambda d: d["id"]))
    .set_force("charge", d3.force_many_body())
    .set_force("x", d3.force_x())
    .set_force("y", d3.force_y())
)

# Create the SVG container.
svg = (
    d3.create("svg")
    .attr("width", width)
    .attr("height", height)
    .attr("viewBox", " ".join(map(str, [-width / 2, -height / 2, width, height])))
    .attr("style", "max-width: 100% height: auto")
)

# Add a line for each link, and a circle for each node.
link = (
    svg.append("g")
    .attr("stroke", "#999")
    .attr("stroke-opacity", 0.6)
    .select_all("line")
    .data(links)
    .join("line")
    .attr("stroke-width", lambda d: sqrt(d["value"]))
)

node = (
    svg.append("g")
    .attr("stroke", "#fff")
    .attr("stroke-width", 1.5)
    .select_all("circle")
    .data(nodes)
    .join("circle")
    .attr("r", 5)
    .attr("fill", lambda d: color(d["group"]))
)

node.append("title").text(lambda d: d["id"])
Create and add event callbacks to the simulation and nodes
# Set the position attributes of links and nodes each time the simulation ticks.
def tick(simulation):
    (
        link.attr("x1", lambda d: d["source"]["x"])
        .attr("y1", lambda d: d["source"]["y"])
        .attr("x2", lambda d: d["target"]["x"])
        .attr("y2", lambda d: d["target"]["y"])
    )
    node.attr("cx", lambda d: d["x"]).attr("cy", lambda d: d["y"])


simulation.on("tick", tick, extra_nodes=link.nodes() + node.nodes())

# Reheat the simulation when drag starts, and fix the subject position.
def dragstarted(event, d, node):
    if not event.active:
        simulation.set_alpha_target(0.3).restart()
    event["subject"]["fx"] = event["subject"]["x"]
    event["subject"]["fy"] = event["subject"]["y"]


# Update the subject (dragged node).osition during drag.
def dragged(event, d, node):
    event["subject"]["fx"] = event.x
    event["subject"]["fy"] = event.y


# Restore the target alpha so the simulation cools after dragging ends.
# Unfix the subject position now that it's no longer being dragged.
def dragended(event, d, node):
    if not event.active:
        simulation.set_alpha_target(0)
    event["subject"]["fx"] = None
    event["subject"]["fy"] = None


# Add a drag behavior.
node.call(
    d3.drag()
    .on("start", dragstarted)
    .on("drag", dragged)
    .on("end", dragended)
)
Create an application and run it locally
svg.create_app().run()
Warning
There are some performance issues that will be fixed in future versions.