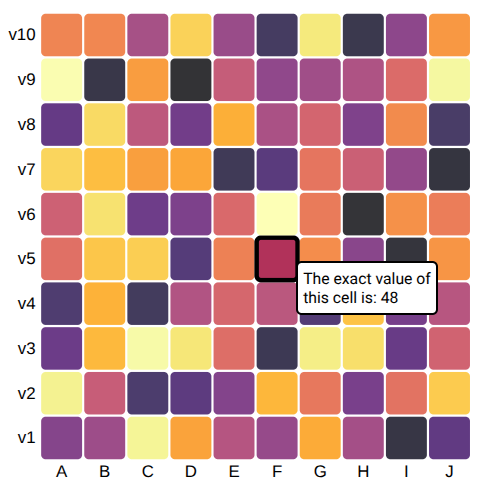
Heatmap
Load data
# https://d3-graph-gallery.com/graph/interactivity_tooltip.html#template
from collections import namedtuple
from pathlib import Path
import detroit_live as d3
import polars as pl

# https://github.com/bourbonut/detroit-live/blob/main/examples/styles/heatmap.css
# Style used later in the example
STYLE_PATH = Path(__file__).resolve().parent / "styles" / "heatmap.css"

URL = "https://raw.githubusercontent.com/holtzy/D3-graph-gallery/master/DATA/heatmap_data.csv"
heatmap = pl.read_csv(URL)
shape: (100, 3)
┌───────┬──────────┬───────┐
│ group ┆ variable ┆ value │
│ ---   ┆ ---      ┆ ---   │
│ str   ┆ str      ┆ i64   │
╞═══════╪══════════╪═══════╡
│ A     ┆ v1       ┆ 30    │
│ A     ┆ v2       ┆ 95    │
│ A     ┆ v3       ┆ 22    │
│ A     ┆ v4       ┆ 14    │
│ A     ┆ v5       ┆ 59    │
│ …     ┆ …        ┆ …     │
│ J     ┆ v6       ┆ 64    │
│ J     ┆ v7       ┆ 4     │
│ J     ┆ v8       ┆ 12    │
│ J     ┆ v9       ┆ 97    │
│ J     ┆ v10      ┆ 72    │
└───────┴──────────┴───────┘
Prepare containers to make the heatmap chart
# Transform data into dictionaries
data = heatmap.to_dicts()

# Process useful data
groups = heatmap["group"].unique().sort().to_list()
variables = heatmap["variable"].unique().to_list()
variables = sorted(variables, key=lambda v: int(v[1:]))

# Declare the chart dimensions and margins
Margin = namedtuple("Margin", ("top", "right", "bottom", "left"))
margin = Margin(20, 25, 30, 40)
width = 450 - margin.left - margin.right
height = 450 - margin.top - margin.bottom

# Create HTML container and add style in <head>
html = d3.create("html")
html.append("head").append("style").text(STYLE_PATH.read_text())
body = html.append("body").append("div")

# Create the SVG container.
svg = (
    body.append("svg")
    .attr("width", width + margin.left + margin.right)
    .attr("height", height + margin.top + margin.bottom)
    .append("g")
    .attr("transform", f"translate({margin.left},{margin.top})")
)

# Tooltip used when an rectangle is hovered
tooltip = body.append("div")

# Declare the x (horizontal position) scale.
x = d3.scale_band().set_range([0, width]).set_domain(groups).set_padding(0.05)

# Add the x-axis.
(
    svg.append("g")
    .style("font-size", 15)
    .attr("transform", f"translate(0,{height})")
    .call(d3.axis_bottom(x).set_tick_size(0))
    .select(".domain")
    .remove()
)

# Declare the y (vertical position) scale.
y = d3.scale_band().set_range([height, 0]).set_domain(variables).set_padding(0.05)

# Add the y-axis.
(
    svg.append("g")
    .style("font-size", 15)
    .call(d3.axis_left(y).set_tick_size(0))
    .select(".domain")
    .remove()
)

# Declare the color scale.
color = (
    d3.scale_sequential().set_interpolator(d3.interpolate_inferno).set_domain([1, 100])
)

# Style the tooltip div
(
    tooltip.style("opacity", 0)
    .attr("class", "tooltip")
    .style("background-color", "white")
    .style("border", "solid")
    .style("border-width", "2px")
    .style("border-radius", "5px")
    .style("padding", "5px")
)
Create event callbacks
def mouseover(event, d, node):
    tooltip.style("opacity", 1)
    d3.select(node).style("stroke", "black").style("opacity", 1)

def mousemove(event, d, node):
    (
        tooltip.text(f"The exact value of<br>this cell is: {d['value']}")
        .style("left", f"{event.client_x + 30}px")
        .style("top", f"{event.client_y}px")
    )

def mouseleave(event, d, node):
    tooltip.style("opacity", 0)
    d3.select(node).style("stroke", "none").style("opacity", 0.8)
Finish the heatmap chart and add event callbacks
def key_data(d):
    if isinstance(d, str) or d is None:
        return ""
    else:
        return f"{d['group']}:{d['variable']}"

(
    svg.select_all()
    .data(data, key_data)
    .enter()
    .append("rect")
    .attr("x", lambda d: x(d["group"]))
    .attr("y", lambda d: y(d["variable"]))
    .attr("rx", 4)
    .attr("ry", 4)
    .attr("width", x.get_bandwidth())
    .attr("height", y.get_bandwidth())
    .style("fill", lambda d: color(d["value"]))
    .style("stroke-width", 4)
    .style("stroke", "none")
    .style("opacity", 0.8)
    .on(
        "mouseover",
        mouseover,
        extra_nodes=[tooltip.node()],
        html_nodes=[tooltip.node()],
    )
    .on(
        "mousemove",
        mousemove,
        extra_nodes=[tooltip.node()],
        html_nodes=[tooltip.node()],
    )
    .on(
        "mouseleave",
        mouseleave,
        extra_nodes=[tooltip.node()],
        html_nodes=[tooltip.node()],
    )
)
Note
In this example, callbacks are going to be applied on <rect> elements by default.
It means that only these nodes will be updated by the specified events.
However, explicitely adding extra_nodes = [tooltip.node()] allows to update the specified extra_nodes.
As well, nodes declared in html_nodes will have their inner HTML content updated.
Warning
Having too many nodes in html_nodes will slow the interactivity when there are too many HTML content to update.
Create an application and run it locally
html.create_app().run()