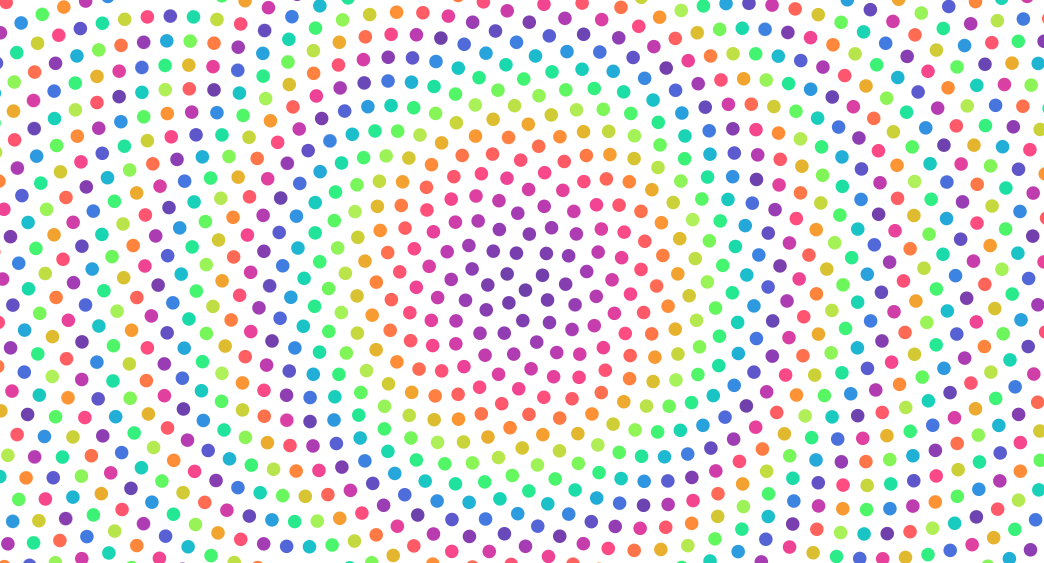
Rainbow circles
Prepare chart dimensions and data
# https://observablehq.com/@d3/drag-zoom
from math import cos, pi, sin, sqrt
from operator import itemgetter
import detroit_live as d3

theta = pi * (3 - sqrt(5))
radius = 6
step = radius * 2
width = 928
height = 500

data = [
    {"x": width * 0.5 + radius * cos(a), "y": height * 0.5 + radius * sin(a)}
    for radius, a in ((step * sqrt(i + 0.5), theta * (i + 0.5)) for i in range(2000))
]
Prepare the SVG container
svg = (
    d3.create("svg")
    .attr("width", width)
    .attr("height", height)
    .attr("viewBox", " ".join(map(str, [0, 0, width, height])))
)

g = svg.append("g").attr("cursor", "grab")
Create drag callbacks and add them to SVG container
def drag_started(event, d, node):
    g.attr("cursor", "grabbing")


def dragged(event, d, node):
    d["x"] = event.x
    d["y"] = event.y
    d3.select(node).attr("cx", event.x).attr("cy", event.y)


def drag_ended(event, d, node):
    g.attr("cursor", "grab")


(
    g.select_all("circle")
    .data(data)
    .join("circle")
    .attr("cx", itemgetter("x"))
    .attr("cy", itemgetter("y"))
    .attr("r", radius)
    .attr("fill", lambda d, i: d3.interpolate_rainbow(i / 360))
    .call(
        d3.drag(extra_nodes=[g.node()])
        .on("start", drag_started)
        .on("drag", dragged)
        .on("end", drag_ended)
    )
)
Note
In this example, callbacks are going to be applied on <svg> elements by default (see d3.drag).
However, in order to update g group, the parameter extra_nodes in d3.drag must be specified.
Create zoom callbacks and add them to SVG container
def zoomed(event, d, node):
    g.attr("transform", str(event.transform))


svg.call(
    d3.zoom(extra_nodes=[g.node()])
    .set_extent([[0, 0], [width, height]])
    .set_scale_extent([1, 8])
    .on("zoom", zoomed)
)
Note
Like d3.drag, in this example, callbacks are going to be applied on <svg> elements by default (see d3.zoom).
However, in order to update g group, the parameter extra_nodes in d3.zoom must be specified.
Create an application and run it locally
svg.create_app().run()