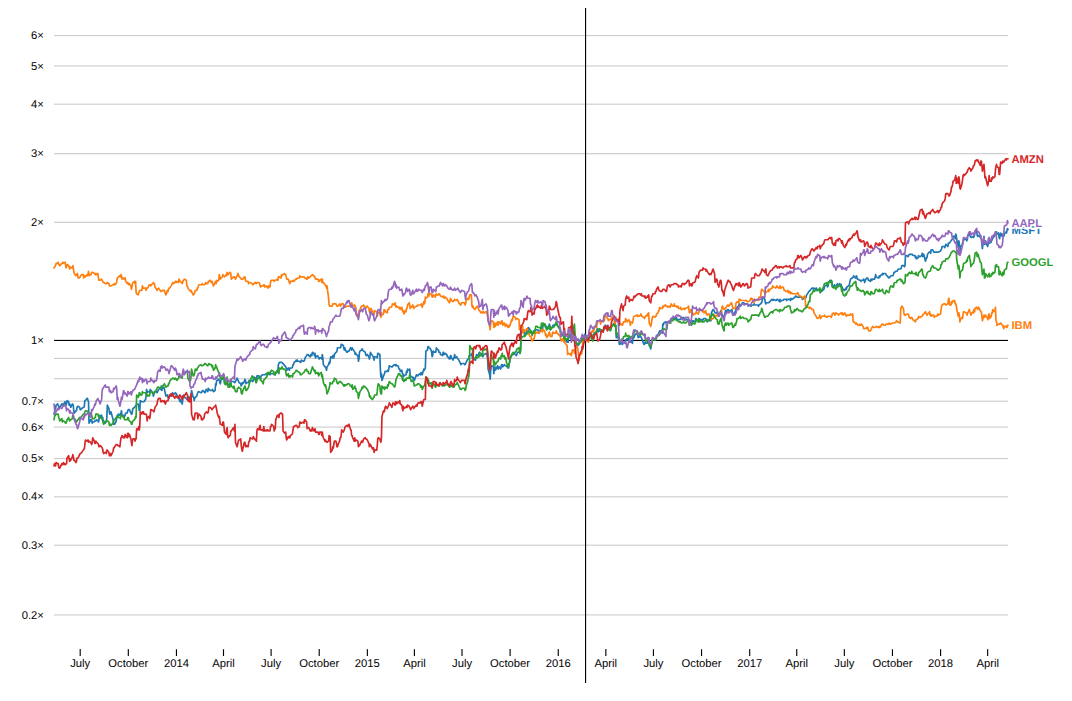
Index Chart
Load data
# Source: https://observablehq.com/@d3/index-chart/2
from bisect import bisect_left
from collections import namedtuple
from functools import reduce
from operator import iadd, itemgetter
from pathlib import Path

import detroit_live as d3
import polars as pl


Margin = namedtuple("Margin", ("top", "right", "bottom", "left"))
URLS = {
    "MSFT": "https://static.observableusercontent.com/files/a3a40558b8a2590e24ccfa34bd62710fbbbe31badd5ad593b7b897b043180a95ae018de2d4e8c92af37cb21395abde4462c3291223ea0652baccfd04db91a749?response-content-disposition=attachment%3Bfilename*%3DUTF-8%27%27MSFT.csv",
    "IBM": "https://static.observableusercontent.com/files/c56b9e232d72bf1df96ca3eeca37e29e811adb72f49d943659a0006c015e74d2c429186d9dca251060784f364eb2a16fd39584695d523588bdcb87e4d9eac650?response-content-disposition=attachment%3Bfilename*%3DUTF-8%27%27IBM.csv",
    "GOOGL": "https://static.observableusercontent.com/files/3ca44f93993f84575ab5461b4097d37b814438266e8cfe8774f70882f49bb289143c190963a158e8dc886989433af1161798ba76f2f4b36d17cc7150cba94477?response-content-disposition=attachment%3Bfilename*%3DUTF-8%27%27GOOG.csv",
    "AMZN": "https://static.observableusercontent.com/files/51ef8c06edd5d139385ad9477c0a42cbf0152f5a4facf30a52d5eaa3ce4debecf1114c4a51199e734274e4411ec8149ffdd0d094cd334095cf8f2a004fc90d44?response-content-disposition=attachment%3Bfilename*%3DUTF-8%27%27AMZN.csv",
    "AAPL": "https://static.observableusercontent.com/files/3ccff97fd2d93da734e76829b2b066eafdaac6a1fafdec0faf6ebc443271cfc109d29e80dd217468fcb2aff1e6bffdc73f356cc48feb657f35378e6abbbb63b9?response-content-disposition=attachment%3Bfilename*%3DUTF-8%27%27AAPL.csv",
}


def load_data() -> dict[str, pl.DataFrame]:
    pwd = Path(__file__).resolve().parent
    data_path = pwd / "data"
    data = {}
    if data_path.exists():
        paths = [data_path / f"{name}.csv" for name in URLS]
        if all((path.exists() for path in paths)):
            for name, path in zip(URLS, paths):
                data[name] = pl.read_csv(path)
            return data
    data_path.mkdir(exist_ok=True)
    for name, url in URLS.items():
        df = pl.read_csv(url)
        df.write_csv(data_path / f"{name}.csv")
        data[name] = df
    return df


data = [
    df.select(
        pl.col("Date").str.to_datetime("%Y-%m-%d"),
        pl.all().exclude("Date"),
        pl.lit(name).alias("Symbol"),
    )
    for name, df in load_data().items()
]
stocks = reduce(iadd, (df.to_dicts() for df in data), [])
Prepare the index chart
# Declare the chart dimensions and margins
width = 928
height = 600
margin = Margin(20, 40, 30, 40)

# Create the horizontal time scale.
x = (
    d3.scale_time()
    .set_domain(d3.extent(stocks, lambda d: d["Date"]))
    .set_range([margin.left, width - margin.right])
    .set_clamp(True)
)


# Normalize the series with respect to the value on the first date. Note that normalizing
# the whole series with respect to a different date amounts to a simple vertical translation,
# thanks to the logarithmic scale! See also https://observablehq.com/@d3/change-line-chart
def update(key_values):
    key, values = key_values
    v = values[0]["Close"]
    values = [{"Date": d["Date"], "value": d["Close"] / v} for d in values]
    return {"key": key, "values": values}


series = [update(key_values) for key_values in d3.groups(stocks, lambda d: d["Symbol"])]


# Create the vertical scale. For each series, compute the ratio *s* between its maximum and
# minimum values the path is going to move between [1 / s, 1] when the reference date
# corresponds to its maximum and [1, s] when it corresponds to its minimum. To have enough
# room, the scale is based on the series that has the maximum ratio *k*  (in this case, AMZN).
def minmax(d):
    values = list(map(itemgetter("value"), d["values"]))
    return max(values) / min(values)


k = max(map(minmax, series))
y = (
    d3.scale_log()
    .set_domain([1 / k, k])
    .set_range_round([height - margin.bottom, margin.top])
)

# Create a color scale to identify series.
z = d3.scale_ordinal(d3.SCHEME_CATEGORY_10).set_domain(
    list(map(itemgetter("key"), series))
)

# Create the SVG container.
svg = (
    d3.create("svg")
    .attr("width", width)
    .attr("height", height)
    .attr("viewBox", [0, 0, width, height])
    .attr(
        "style",
        "max-width: 100% height: auto; -webkit-tap-highlight-color: transparent;",
    )
)

# Create the axes and central rule.
(
    svg.append("g")
    .attr("transform", f"translate(0,{height - margin.bottom})")
    .call(d3.axis_bottom(x).set_ticks(width / 80).set_tick_size_outer(0))
    .call(lambda g: g.select(".domain").remove())
)

(
    svg.append("g")
    .attr("transform", f"translate({margin.left},0)")
    .call(d3.axis_left(y).set_ticks(None, lambda x: str(x) + "×"))
    .call(
        lambda g: g.select_all(".tick line")
        .attr("stroke-opacity", lambda d: None if d == 1 else 0.2)
        .attr("x2", width - margin.left - margin.right)
    )
    .call(lambda g: g.select(".domain").remove())
)

min_date = min(map(itemgetter("Date"), stocks))
rule = svg.append("g").attr("transform", f"translate({x(min_date) + 0.5}, 0)")
(rule.append("line").attr("y1", height).attr("y2", 0).attr("stroke", "black"))

# Create a line and a label for each series.
serie = (
    svg.append("g")
    .style("font", "bold 10px sans-serif")
    .select_all("g")
    .data(series)
    .join("g")
)

line = d3.line().x(lambda d: x(d["Date"])).y(lambda d: y(d["value"]))

(
    serie.append("path")
    .attr("fill", "none")
    .attr("stroke-width", 1.5)
    .attr("stroke-linejoin", "round")
    .attr("stroke-linecap", "round")
    .attr("stroke", lambda d: z(d["key"]))
    .attr("d", lambda d: line(d["values"]))
)

(
    serie.append("text")
    .attr("fill", lambda d: z(d["key"]))
    .attr("paint-order", "stroke")
    .attr("stroke", "white")
    .attr("stroke-width", 3)
    .attr("x", x.get_range()[1] + 3)
    .attr("y", lambda d: y(d["values"][-1]["value"]))
    .attr("dy", "0.35em")
    .text(lambda d: d["key"])
)
Create and add event callbacks to the index chart
# When the user mouses over the chart, update it according to the date that is
# referenced by the horizontal position of the pointer.
def transform(values, date):
    values = values["values"]
    # For each given series, the update function needs to identify the
    # date - closest to the current date—that actually contains a value. To do
    # this efficiently, it uses a bisector:
    i = bisect_left(list(map(itemgetter("Date"), values)), date, 0, len(values) - 1)
    return f"translate(0,{y(1) - y(values[i]['value'] / values[0]['value'])})"


def mouvemove(event, d, node):
    date = x.invert(d3.pointer(event, node)[0])
    rule.attr("transform", f"translate({x(date) + 0.5}, 0)")
    serie.attr("transform", lambda values: transform(values, date))
    svg.attr("value", date)


svg.on(
    "mousemove touchmove",
    mouvemove,
    extra_nodes=rule.nodes() + serie.nodes() + svg.nodes(),
)
Create an application and run it locally
svg.create_app().run()